Data Scientists spend a significant amount of time visualizing data for storytelling or conveying insights to end users of a data product. Often, the ability to succinctly and accurately explain the methods used and insights derived hinges on the medium of communication and time taken to prepare visualizations. In order to limit time spent on manually building reports or PowerPoint slides, one page at a time, we could automate the process. Let’s automatically create a slide deck containing plots created in Python. It’s not too hard, but there are a few tips that definitely make the process easier. We will use the python-pptx library read in template PowerPoint files and create new slides with exciting content. Python-pptx has the capability to add text, SmartArt, and other media formats to slides based on a template file.
Prep the Template PowerPoint file
Delete all slides in Template PowerPoint file
Delete all slides in the file as any slides in the file will be automatically added to your new slide deck. Sadly, the python-pptx library does not allow deletion of slides, so we need the template file to be empty.
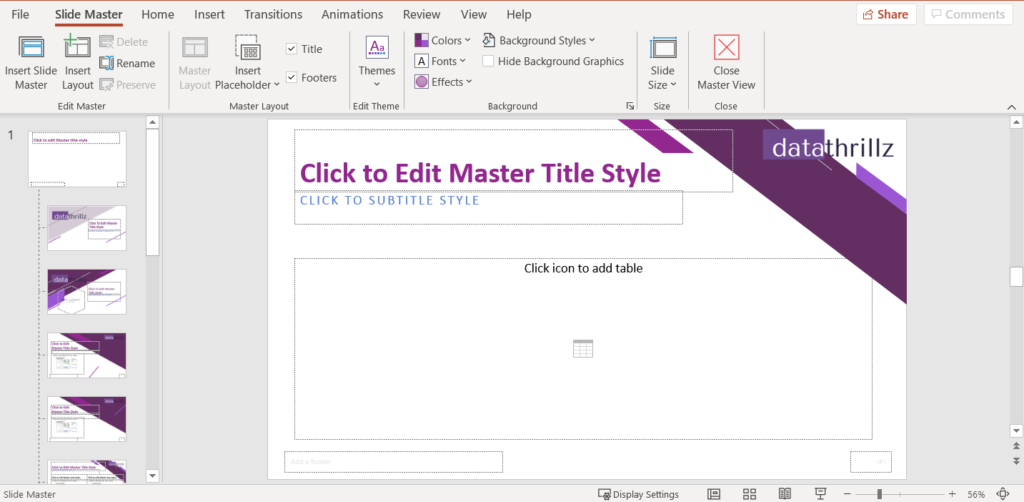
Customize Template PowerPoint file via Slide Master View
We can tailor the look of our slides as we would like them to appear. For instance, we can specify the location of images, charts or text on slides. In order to insert images, we must specify an image placeholder (not a general-purpose content placeholder). To make changes to the layout of our template slides:
- Open your template PowerPoint file
- Go to View -> Slide Master to show all slide templates
- Customize template slides by adding new slides with specific placeholders in the locations desired. To insert Picture placeholder, select a template slide or copy thereof, go to Slide Master tab, click Insert Placeholder, choose Picture, then draw a rectangular outline where you want the image to appear on the slide.
- Delete any elements that you do not want
- Switch back to Normal View and save the template PowerPoint file, otherwise our new slide deck will open in the Slide View by default.

Generate a PowerPoint Markup
Run the analyze_ppt.py script in the command line with your empty Template PowerPoint file as input to generate a labeled markup of the standard slide types in your PowerPoint presentation.
python analyze_ppt.py datathrillz_template.pptx datathrillz_template_markup.pptx
This markup PowerPoint file will allow us to easily identify the slide layout and the content placeholders that we want to use.
Automagically Generate PowerPoint Slides
Now that the template file is prepared and we know how to access various placeholders on a slide, we can programmatically build our deck. Below, I include code for importing necessary libraries and create helper functions for generating the PowerPoint.
import pandas as pd
import numpy as np
from datetime import date
import matplotlib.pyplot as plt
import seaborn as sns

def _add_image(slide, placeholder_id, image_url):
    '''
    Funtion to add an image to a PowerPoint slide with a Picture placeholder.
    Will automatically insert the image without cropping the image
    Arguments:
     - slide: slide object from the python-pptx library containing the slide on which you want the table to appear
     - placeholder_id - index of the Picture placeholder
     - image_url - path to the image
    '''
    from PIL import Image
    placeholder = slide.placeholders[placeholder_id]

    # Calculate the image size of the image
    im = Image.open(image_url)
    width, height = im.size

    # Make sure the placeholder doesn't zoom in
    placeholder.height = height
    placeholder.width = width

    # Insert the picture
    placeholder = placeholder.insert_picture(image_url)

    # Calculate ratios and compare
    image_ratio = width / height
    placeholder_ratio = placeholder.width / placeholder.height
    ratio_difference = placeholder_ratio - image_ratio

    # Placeholder width too wide:
    if ratio_difference > 0:
        difference_on_each_side = ratio_difference / 2
        placeholder.crop_left = -difference_on_each_side
        placeholder.crop_right = -difference_on_each_side
    # Placeholder height too high
    else:
        difference_on_each_side = -ratio_difference / 2
        placeholder.crop_bottom = -difference_on_each_side
        placeholder.crop_top = -difference_on_each_side
    return(slide)

def df_to_table(slide, df):
    """
    Adds a table to slide of a PowerPoint presentation containing a Table placeholder.
    The table is a standard Powerpoint table, and can easily be modified with the Powerpoint tools,
    for example: resizing columns, changing formatting etc.
    Arguments:
     - slide: slide object from the python-pptx library containing the slide on which you want the table to appear
     - df: Pandas DataFrame with the data
     """
    title = slide.shapes.title
    title.text = "Summary Table for Iris Dataset"
    table_placeholder = slide.placeholders[12]
    rows,cols = report_data.shape
    shape = table_placeholder.insert_table(rows=rows+1, cols=cols+1)
    table = shape.table
    # do column header
    for ch,head in enumerate(report_data.columns.tolist()):
        cell = table.cell(0, ch+1)
        cell.text = head

    # row headers
    for rh, head in enumerate(report_data.index.tolist()):
        cell = table.cell(rh+1, 0)
        cell.text = head

    for rr in range(rows):
        for cc in range(cols):
            cell = table.cell(rr+1, cc+1)
            cell.text = "{:.2f}".format(df.iloc[rr,cc])

def create_ppt(infile, outfile, report_data, chart):
    """ Take the input powerpoint file and use it as the template for the output
    file.
    Arguments:
    - infile: input/template PowerPoint file path
    - outfile: path to name of output PowerPoint file
    - report_data: dataframe with report data
    - chart: path to the image for insertion
    """
    from pptx import Presentation
    from pptx.util import Inches

    prs = Presentation(infile)
    # Use the output from analyze_ppt to understand which layouts and placeholders
    # to use
    # Create a title slide first
    title_slide_layout = prs.slide_layouts[0]
    slide = prs.slides.add_slide(title_slide_layout)
    title = slide.shapes.title
    subtitle = slide.placeholders[1]
    title.text = "Report on the Iris Data Set"
    subtitle.text = "Generated on {:%m-%d-%Y}".format(date.today())

    # Create the summary chart
    graph_slide_layout = prs.slide_layouts[10]
    slide = prs.slides.add_slide(graph_slide_layout)
    title = slide.shapes.title
    title.text = "Bar Plot of Mean Sepal Width from Iris Dataset"
    slide = _add_image(slide,1,chart)

    # Add Table Slide
    slide = prs.slides.add_slide(prs.slide_layouts[6])
    df_to_table(slide, report_data)

    prs.save(outfile)
Now, we generate the PowerPoint file, one slide at a time – starting with the title slide and ending with a slide with an inserted table.
report_name = r"datathrillz\pptx_python\iris.csv"
df = pd.read_csv(report_name)
report_data = create_pivot(df)
chart_path = r"datathrillz\pptx_python\report-image.png"
create_chart(df, chart_path)
infile = r"datathrillz\pptx_python\datathrillz_template.pptx"
outfile = r"datathrillz\pptx_python\final_report.pptx"
create_ppt(infile, outfile, report_data, chart_path)
Here are the slides generated (in order of appearance: title slide, slide with inserted Image and slide with inserted Table):


We can add new material to the PowerPoint before sending it out. By automatically exporting figures to PowerPoint, valuable time is saved so we can focus on other more exciting things. This process fits well into the reporting part of a data analysis workflow and is time-efficient if slide decks must be repeatedly produced. However, there are a few limits of python-pptx to keep in mind when generating PowerPoint files:
- python-pptx cannot delete slides
- python-pptx cannot add components to the slide, only fill in placeholders. Users must pre-specify the text placeholder if they want to insert text, and similarly for images and other media.
- python-pptx cannot input vector-based image formats into the PowerPoint file only .jpeg, .png. or .gif.
This article has demonstrated how to create PowerPoint presentations using Python and the ease of using this process for a business reporting use case. Anyone can use PowerPoint, which makes it easy to follow the story that the data paints.
